Project Documentation
Use this hosted documentation site to tell your data story. Include a narrative telling your results, observations, and interpretations. Display visuals as needed for a compelling story.
Professional Workflow
See Workflow B: Apply Example Project to get a project like this running on your machine.
Documentation Index
- Home - this landing page
- Project Instructions
- Concepts
- Data Card
- API
Initial Results
After reviewing the related tables in your chosen domain, use the code in the src/datafun folder to get them in a database so we can use SQL to join and query the related tables.
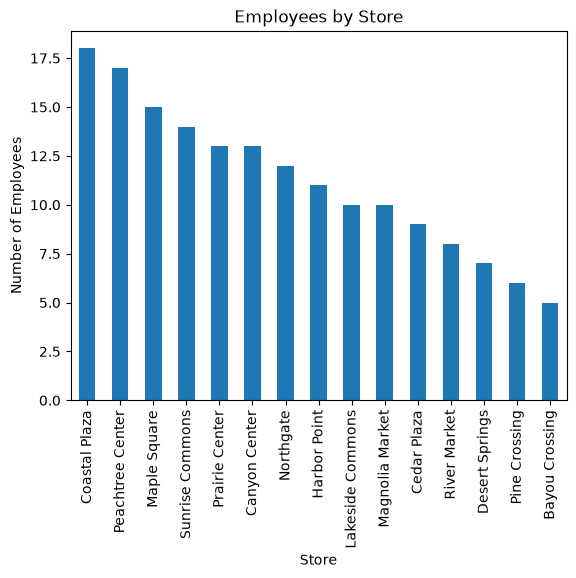
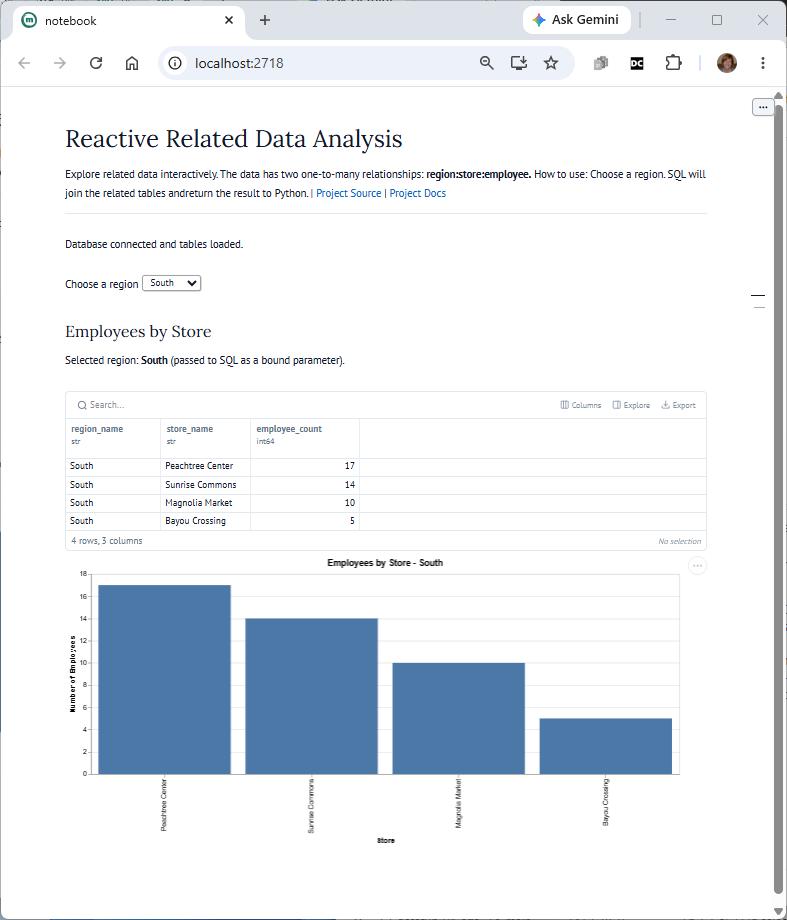
Produced Artifacts
This project produces the same results in several useful forms.
- Reactive App (marimo)
- run the analysis interactively in a browser